Time-gating and Other Fluorescence Suppression Techniques
Fluorescence interference is a common challenge when using Raman techniques. The fluorescence interference can raise the baseline levels of spectra, decreasing the SNR, and in worst cases, the interference can completely obscure or “swamp” the Raman signals.
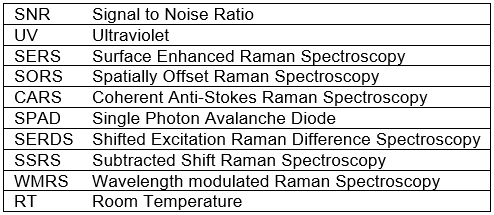
Abbreviations
Fluorescence Interference and the Use of Different Excitation Wavelengths
One common method of limiting the amount of fluorescence interference is to use longer wavelength excitation. This poses its own challenges as the Raman scattering intensity is related to the fourth power of the frequency of the excitation laser (1) (2). Using a longer wavelength excitation laser usually decreases the amount of fluorescence interference but it also dramatically decreases the Raman signal intensities.
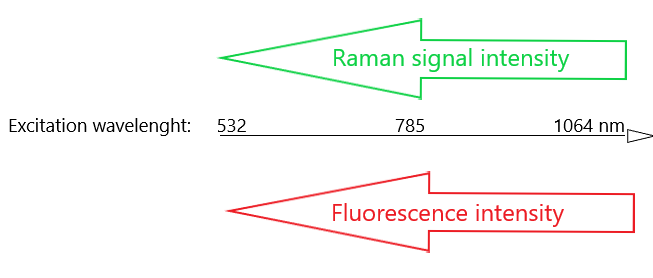
Increasing excitation laser wavelength decreases fluorescence interference but it also significantly decreases Raman signal intensities.
Since molecular fluorescence is mostly present at wavelengths longer than 300nm, UV resonance Raman spectroscopy can produce promising measurement results. A downside is that the UV excitation can easily induce sample degradation and strong absorption in the UV region might decrease observed Raman intensities. (3) (4) (5) (6)
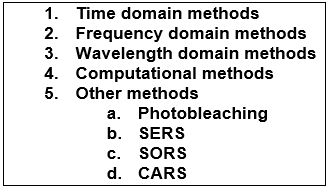
In addition to choosing the most optimal excitation wavelengths, many other methods have been developed for reducing the severity of fluorescence interference. Fluorescence suppression techniques can be classified into five categories (7) (2):
Time Domain Methods for Reducing the Fluorescence Interference
Time domain methods, including time-gating, make use of the temporal differences of fluorescence emission and Raman scattering. In some cases, these techniques enable the use of lower wavelength excitation lasers, which leads to higher Raman scattering intensities while rejecting most of the fluorescence interference. (8) (9)
Time-gating techniques often use pulsed lasers, which produce pulse-like responses (see the figure below) which are then selectively sampled. Fast detectors can be used to collect information during moments where most of the Raman scattering is located while excluding most of the fluorescence interference. This exclusion is most effectively realized when fluorescence has a long delay compared with Raman scattering i.e., when there is a minimal amount of temporal overlap between Raman scattering and fluorescence emission. Read more about SPAD-based Timegated® fluorescence suppression techniques: Timegated® Raman Technology.
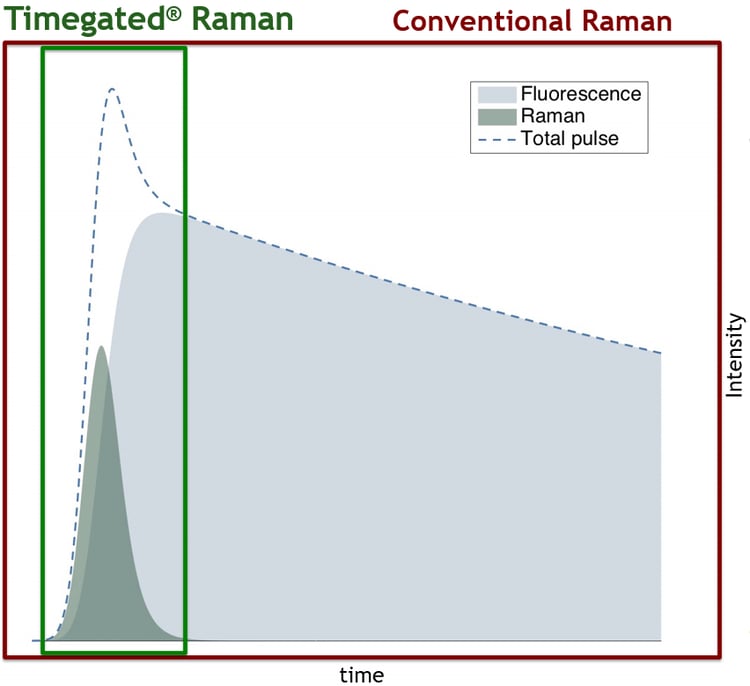
Time-gated fluorescence suppression is based on the temporal exclusion of fluorescence.

Modern SPAD-based time-domain techniques have reached sub-nanosecond time-gating while keeping the benchtop device sizes compact without the explicit need for detector cooling. Modern SPAD detectors also enable sufficient spectral resolutions for most Raman applications. (10) (11) (2)
Frequency Domain Methods for Reducing the Fluorescence Interference
Frequency domain and time domain methods are related to each other by Fourier transformation. Frequency domain methods are based on the different behaviors of fluorescence and Raman scattering under high-frequency modulation. Raman scattering can follow the high-frequency modulation of the excitation light almost instantly, unlike the slower fluorescence emission. These techniques aim to resolve the sample’s Raman scattering contribution while minimizing fluorescence interference. Frequency domain techniques can produce promising fluorescence suppression results, although the technique often requires a complicated system and may not work well over a large spectral range. Frequency domain techniques might also have difficulties in reducing statistical noise. Any noise in the fluorescence signal (e.g. shot noise) will contribute to the Raman spectrum and phase nulling techniques may require high Raman signal intensities to overcome the fluorescence noise. (7) (2) (12)
Wavelength Domain Methods for Reducing the Fluorescence Interference
Wavelength domain methods make use of the fact that fluorescence has broader characteristics on a wide spectral range, and that fluorescence is quite insensitive to small excitation wavelength changes while Raman signals are coupled with the excitation wavelength. Common wavelength domain methods include wavelength-modulated Raman spectroscopy (SERDS) and subtracted shifted Raman spectroscopy (SSRS). (7) (2) (12)
SERDS makes use of at least two slightly different excitation wavelengths. As fluorescence is less sensitive to shifts in excitation wavelength, the fluorescence is mostly cancelled out in the difference spectrum resulting from these excitation wavelengths. Several mathematical methods can then be used to construct conventional Raman spectra from the raw difference spectra. Most often the resulting Raman spectra have improved spectral quality and less fluorescence interference. (7) (12) (2)
SSRS is a similar technique to SERDS, but instead of requiring a tunable laser source, the spectra are acquired at several different closely spaced spectrometer positions. Wavelength domain techniques also include wavelength-modulated Raman spectroscopy (WMRS) where the excitation wavelength is modulated slightly while acquiring the Raman signal. SERDS, SSRS, and WMRS require a computational data processing step after data acquisition and the spectral reproduction has a strong dependence on the noise level of the spectra. (7) (12) (2) (13)
Computational Methods for Reducing the Fluorescence Interference
Mathematical methods are standard techniques for suppressing fluorescence interference. These methods can in some cases produce artifacts in processed data which could affect the validity of the collected information (13). When fluorescence emission has already distorted the measured spectra, computational methods have a very limited capability for improving SNR (2).
Automated baseline correction methods may produce less than optimized results and it can be challenging to find baseline correction parameters that fit a wider variety of different sample types (2). Sample type-specific tweaking of the correction parameters may be required. Computational baseline correction techniques are still very useful for illustration purposes and they can be combined with most other fluorescence suppression techniques as a post-processing option.
Other Fluorescence Suppression Methods
Photobleaching
Photobleaching is a technique that can reduce fluorescence interference and it can be combined with several other fluorescence suppression techniques. Photobleaching can be achieved by exposing a sample to laser light prior to measurement. This may quench fluorescence effects while keeping the Raman scattering process unchanged. The laser used for photobleaching is often the same laser that is used for the Raman excitation and it should be noted that high photobleaching laser powers may cause sample alteration. Repeatable photobleaching for quantitative work may be challenging to achieve and photobleaching may deteriorate the performance of calibration models. (7) (14) (15)
SERS
SERS (surface-enhanced Raman spectroscopy) techniques may also improve results by quenching fluorescence effects and by increasing the Raman signal intensities. This surface-sensitive technique can be implemented by using suitable substrates or nanostructures. SERS can be combined with other fluorescence suppression techniques and quite recently the combination of SPAD-based time-gated Raman and SERS has produced promising results. (16) (17) (18)
SORS
SORS (spatially offset Raman spectroscopy) may be a useful technique for measuring turbid or layered samples. This technique uses a spatial offset between the illumination and the collection regions on the surface of the sample. SORS enables measurements from different layers of the sample (e.g. through a sample container) while reducing fluorescence and other signal contributions of layers that are not of interest. (19) (20)
CARS
CARS (coherent anti-Stokes Raman spectroscopy) makes use of two (or three) lasers that are used to irradiate a sample simultaneously. A coherent Raman response can be generated by tuning the frequencies of the two beams to match a particular molecular vibration. The technique is often tuned for collecting vibrationally selective data which enables fast acquisition times but only grants very selective narrowband information. The coherent Raman response usually has a higher intensity than conventional Raman and it has minimal fluorescence issues as anti-Stokes scattering occurs at a different wavelength range from fluorescence. The spectra may still include an interfering non-resonant background. CARS can produce promising results, but the multi-laser setup can be complex and the complexity can increase cost and produce some challenges for routine measurements (e.g. alignment drift between the two collinear beams). (21) (22) (2)
Anti-Stokes Raman measurements can also be carried out without a CARS setup and the anti-Stokes Raman shift region may have the advantage of containing a lower amount of fluorescence. A challenge with non-CARS anti-Stokes measurements is that in RT conditions the anti-Stokes Raman signal intensities are usually low. In high-temperature measurements, the anti-Stokes Raman signal contributions are higher and these responses can be useful for data acquisition and for e.g. temperature determinations. (23) (24) (25)
Conclusions
The most suitable fluorescence suppression technique will vary depending on the studied application. Some techniques are only applicable to a limited range of application types, and the techniques may require expensive measurement setups or extensive knowledge to operate. Other techniques (e.g., computational methods) may be applicable for a very wide range of applications, but the ultimate fluorescence suppression capabilities may remain limited. When deciding on suppression methods, the decision process might include the following points: What are the current and future application needs, sample types, budgetary limits, the required know-how to operate the device, the size and portability of the device, and any potential combinations of different suppression techniques?
References
- Even Smith, Geoffrey Dent. Modern Raman Spectroscopy - A Practical Approach. s.l. : John Wiley & Sons Ltd, 2005, pp. 2, 24, 30.
- Time-gated Raman spectroscopy - a review. Martin Kögler, Bryan Heilala. 2020, Meas. Sci. Technol.
- UV Raman spectroscopy for the characterization of strongly fluorescing beverages. Rasha M. El-Abassy, Bernd von der Krammer, Arnulf Materny. 2015, LWT Food Sci. Technol., Vol. 64, pp. 56-60.
- UV Raman spectroscopic study on the phase transformation of ZrO2, Y2O3-ZrO2 and SO42-/ZrO2. Can Li, Meijun Li. 2002, J. Raman Spectrosc., Vol. 33, pp. 301-308.
- Termperature-dependent Photodegradation in UV-resonance Raman Spectroscopy. Hikaru Yoshino, Yuika Saito, Yasuaki Kumamoto, Atushi Taguchi, Prabhat Verma, Satoshi Kawata. 2015, Anal. Sci., Vol. 31, pp. 451-454.
- A comparison of ultraviolet and visible Raman spectra of supported metal oxide catalysts. Yek Tann Chua, Peter C. Stair, Israel E. Wachs. 2001, J. Phys. Chem. B, Vol. 105, pp. 8600-8606.
- Review of fluorescence suppression techniques in Raman spectroscopy. Dong Wei, Shuo Chen, Quan Liu. 2015, Appl. Spectrosc. Rev., Vol. 50, pp. 387-406.
- Time-Gated Raman Spectroscopy for Quantitative Determination of Solid-State of Fluorescent Pharmaceuticals. Tiina Lipiäinen, Jenni Pessi, Parisa Movahedi, Juha Koivistoinen, Lauri Kurki, Mari Tenhunen, Jouko Yliruusi, Anne M. Juppo, Jukka Heikkonen, Tapio Pahikkala, Clare J. Strachan. 2018, Anal. Chem., Vol. 90, pp. 4832-4839.
- Fluorescence-suppressed time-resolved Raman spectroscopy of pharmaceuticals using complementary metal-oxide semiconductor (CMOS) single-photon avalanche diode (SPAD) detector. Tatu Rojalin, Lauri Kurki, Timo Laaksonen, Tapani Viitala, Juha Kostamovaara, Keith C. Gordon, Leonardo Galvis. 2016, Anal. Bioanal. Chem., Vol. 408, pp. 761-774.
- A sub-ns time-gated CMOS single photon avalanche diode detector for Raman spectroscopy. I. Nissinen, J. Nissinen, A-K. Länsman, L. Hallman, A. Kilpelä, J. Kostamovaara, M. Kögler, M. Aikio, J. Tenhunen. 2011, J. Proc. of ESSDERC'11, Vols. 12-16, p. 375.
- A 2x(4)x128 Multi-time-gated SPAD Line Detector for Pulsed Raman Spectroscopy. I. Nissinen, J. Nissinen, P. Keränen, A. Länsman, J. Holma, J. Kostamovaara. 2015, IEEE J. Sens., Vol. 15, p. 1358.
- Modulated Raman spectroscopy for enhanced cancer diagnosis at the cellular level. Anna Chiara De Luca, Kishan Dholakia, Michael Mazilu. 2015, Sensors, Vol. 15, pp. 13680-13704.
- Online fluorescence suppression in modulated Raman spectroscopy. Anna Chiara De Luca, Michael Mazilu, Andrew Riches, C. Simon Herrington, Kishan Dholakia. 2010, Anal. Chem., Vol. 82, pp. 738-745.
- Photobleaching as a useful technique in reducing of fluorescence in Raman spectra of blue automobile paint samples. Janina Zieba-Palus, Aleksandra Michalska. 2014, Vib. Spectrosc., Vol. 74, pp. 6-12.
- Effects of photobleaching on calibration model development in biological Raman spectroscopy. Ishan Barman, Chae-Ryon Kong, Gajandra P. Singh, Ramachandra R. Dasari. 2011, J. Biomed. Opt., Vol. 16, p. 011004.
- A review on surface-enhanced Raman scattering. Roberto Pilot, Rafaella Sinorini, Christian Durante, Laura Orian, Manjari Bhamidipati, Laura Fabris. 2019, Biosensors, Vol. 9, p. 57.
- Assessment of recombinant protein production in E. coli with time-gated surface enhanced Raman spectroscopy (TG-SERS). Martin Kögler, Jaakko Itkonen, Tapani Viitala, Marco G. Casteleijn. 2020, Sci. Rep., Vol. 10, p. 2472.
- Comparison of time-gated surface-enhanced Raman spectroscopy (TG-SERS) and classical SERS based monitorin of Escherichia coli cultivation samples. Martin Kögler, Andrea Paul, Emmanuel Anane, Mario Birkholz, Alex Bunker, Tapani Viitala, Michael Maiwald, Stefan Junne, Peter Neubauer. 2018, Biotechnol. Prog., Vol. 34, pp. 1533-1542.
- A Spatially Offset Raman Spectroscopy Method. Kuanglin Chao, Sagar Dhakal, Jianwei Qin, Yankun Peng, Walter F. Schmidt, Moon S. Kim, Diane E. Chan. 2017, Sensors, Vol. 17, p. 618.
- Sensitivity of spatially offset Raman spectroscopy (SORS) to subcortical bone tissue. Guanping Feng, Marien Ochoa, Jason R. Maher, Hani A. Awad, Andrew J. Berger. 2017, J. Biophotonics, Vol. 10, pp. 990-996.
- Coherent anti-Stokes Raman scattering microscopy: overcoming technical barriers for clinical translation. Haohua Tu, Stephen A. Boppart. 2014, J. Biophotonics, Vol. 7, pp. 9-22.
- Coherent anti-Stokes Raman scattering microscopy: Chemical imaging for biology and medicine. Conor L. Evans, X. Sunney Xie. 2008, Annu. Rev. Anal. Chem., Vol. 1, pp. 883-909.
- Raman thermometry. Tuschel, David. Dec 2016, Spectroscopy solutions for materials analysis, pp. 8-13.
- Advantage of Anti-Stokes Raman Scattering for High-Temperature Measurements. Hirotaka Fujimori, Koji Ioku, Masahiro Yoshimura. 2001, Appl. Phys. Lett., Vol. 79, pp. 937-939.
- Raman temperature measurement. D.S. Moore, S. D. McGrane. 2014, J. Phys. Conf Ser., Vol. 500.
Author
 This blog was written by Timegate Instruments’ Senior Application Specialist Bryan Heilala. Bryan is a young and energetic chemist with a degree in M.Sc. (chemistry) and experience and background in analytical chemistry. Read more about him and the whole Timegate team.
%20kuvituskuva%20Timegaten%20korostusv%C3%A4rill%C3%A4.png?width=800&name=Spodumeeni%20(LiAlSi2O6)%20kuvituskuva%20Timegaten%20korostusv%C3%A4rill%C3%A4.png)
