Timegated® Raman Spectral Analysis with Chemometric Modeling
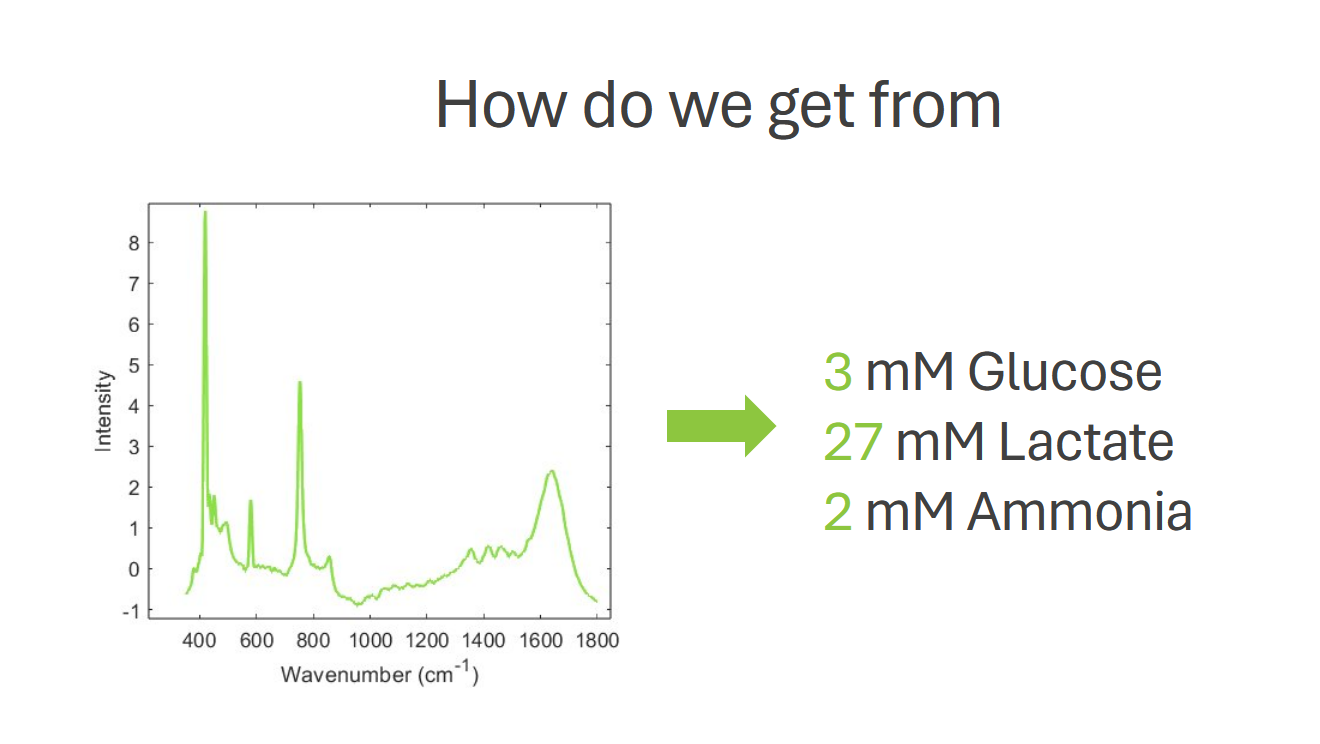
The picture illustrates the question of how we get a concentration estimate from a Raman spectrum.
We know that Raman spectra are highly specific to different types of molecules, or even different parts of large molecules, and their proportions in a given material. However, based on visual inspection alone, even an experienced spectroscopist can struggle to interpret Raman spectra. To extract detailed information on the sample in question from a spectrum, more comprehensive data analysis is often required. This analysis often consists of chemometric calibration.

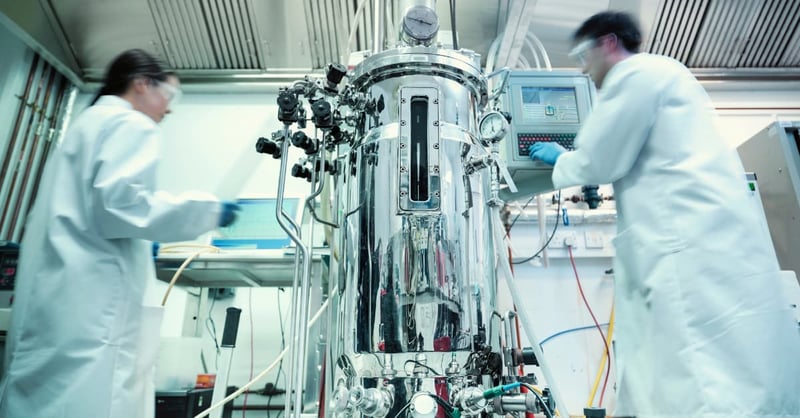
Timegate Instrument's Data Analyst Sofia Lane pictured at the Timegate office. Sofia conducted her Master's thesis on chemometric modeling in CHO cell culture applications.
Chemometric Calibration for Timegated® Raman spectra
Chemometric calibration refers to the process of constructing a model that uses the Raman spectrum of a sample to predict some properties of the sample. These properties are referred to as the response variable of the model and can be, for example, the concentration, mass, or volume of a specific analyte in the sample, in which case the response variable is continuous and the model is called a regression model.
Alternatively, one might wish to detect the presence of a contaminant in a sample or identify the sample from a set number of options. In this case, the response variable is discrete, and the model is called a classification model.
Defining the Relation Between Raman Spectrum and Response Variable
To make these predictions, a model must understand how changes in the Raman spectrum relate to changes in the response variable. There are two different approaches to defining this relation.
Data-driven Models
The first and most common approach is to use a large set of example spectra measured from samples with known response variable values. This is called a training set and, as the name suggests, the examples are used to train the model to recognize when a spectrum corresponds to which response variable value; much like how you might, purely from experience, be able to estimate someone’s age based on their height, hair color, and complexion.
These types of models are referred to as soft or data-driven models, and rely on statistics and machine learning principles such as least-squares curve fitting and multivariate optimization. The most widely used soft model in chemometrics is partial-least squares regression, but machine learning methods like support vector machine, and random forest are also used for chemometric calibration.
Physics-based Models
The second approach to defining the relationship between the Raman spectrum and the response variable is to utilize knowledge of how exactly the Raman spectrum is formed.
This usually means referring to the Beer-Lambert law, which states that intensity at a given wavenumber is proportional to concentration. We can then consider a spectrum of a mixture sample the weighted sum of the spectra of the pure mixture components, where the concentrations of the components in the mixture act as weights. In theory, it is then possible to estimate the concentration of a given analyte based on the mixture spectrum and the analyte’s spectrum.
These types of models are called hard or physics-based models and commonly require knowledge of the response analyte’s spectrum. Some prominent hard chemometrics models are indirect hard models, classical least squares, and multivariate curve resolution.
Comparison of Hard and Soft Models in Chemometrics
Hard models are less commonly used than soft models in chemometrics. This is perhaps because their accuracy depends on how well you can account for all the factors influencing the formation of the spectra: a challenge that only gets more difficult as the complexity of your samples increases. Soft models require comparatively less understanding of the spectral phenomena at play but instead rely on large training sets that can be time-consuming and costly to compile.
Overcoming these challenges is the focus of research in the field, including novel algorithm design, sample manipulation, and the use of generative AI. The more ease and accuracy we can attain in our chemometric modeling, the more fully we can harness the power of Raman spectroscopy in process analytics.
Read more about chemometric calibration in my Master’s thesis on multivariate modeling for Raman spectroscopy in CHO perfusion cell cultures.
Author
 This blog was written by Timegate Instruments’ Data Analyst Sofia Lane. Sofia recently graduated with honors from the Master's program in Mathematics and Operations Research. At Timegate, Sofia works with chemometric calibration methods in biopharmaceutical applications.