Identifying and Distinguishing Hematite and Magnetite with Timegated® Raman
Distinguishing different iron oxides can be vital in various mining and metallurgy applications as different iron oxides have varied physical and chemical properties. These dissimilar properties can cause differences in industrial processes (e.g. sintering and pelletization)[1]. It might also be vital to identify and gather information from different oxide or slag layers as they often contain information regarding different chemical processes (e.g. corrosion).
How might different kinds of metal oxides be analysed using time-gated Raman?
This blog gives a brief introduction and a few examples regarding some aspects of time-gated Raman iron oxide measurements. Other iron oxide detection and separation methods include techniques based on X-ray spectroscopy and techniques that rely on differences in the iron oxide magnetic properties [2, 3]. These methods often require sample preparation (e.g. sample grinding or milling) and they are often more challenging to apply for continuous and on-line measurements.
Several emission and absorption spectroscopy techniques provide elemental information. However, there are many cases where elemental information is not sufficient and molecular or crystal structure information is needed. Metal oxide determinations are important in many industrial fields and techniques that atomize or ionize samples often lose a significant part of the original composition and structure information. Vibrational spectroscopy methods like Raman spectroscopy, however, provide information regarding the molecular structure. These techniques also require minimal sample preparation.
Time-gated Raman is not as sensitive to background or thermal emission as conventional Raman so the measurements can be done in ambient lighting and with heated samples.
As an example case, an alloy with different oxide layers are presented in figure 1. Two distinct layers can be observed: a darker brown layer and a metallic blue layer that seemed to not only reside next to the brown layer but also underneath it. The measurements can be done simply by pointing the laser at the sample (in this case the oxide layer) and beginning the data acquisition after choosing the optimal measurement parameters. Time-gated Raman is not as sensitive to background or thermal emission as conventional Raman so the measurements can be done in ambient lighting and with heated samples.
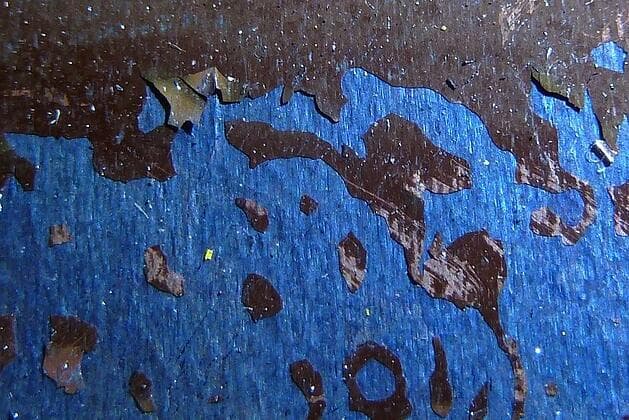
Figure 1. The analysed metallic blue and brown oxide layers.
Care should be taken to precisely focus the laser on the point of interest and it should be noted that some samples degrade over time when exposed to intense photon emission. Some iron oxides, like magnetite, are prime examples of materials that begin to oxidize when exposed to a strong laser beam or high temperatures. If the oxide composition is of interest, then a lower laser power or a larger measurement spot size should be used in order to minimize any degradation or changes in the studied reactive material.
The measured spectra from the two different oxide layers are presented in figure 2 in addition to a reference hematite (Fe2O3) spectrum. As seen in figure 2, the brown layer spectrum matches the hematite reference spectrum quite well. The blue layer spectrum, however, seems to include a clearly defined 668 cm-1 band which better matches a magnetite (Fe3O4) Raman response. If the measurements are done using a high laser power, it can be observed that the blue oxide layer spectrum begins to resemble the brown layer spectrum as the measurement (and the laser exposure time) advances. This indicates that the blue layer changes when exposed to high intensity laser emission. The conversion rate seemed to correlate with the particle size of the analysed substance probably because of the difference in exposed and reactive surface area.
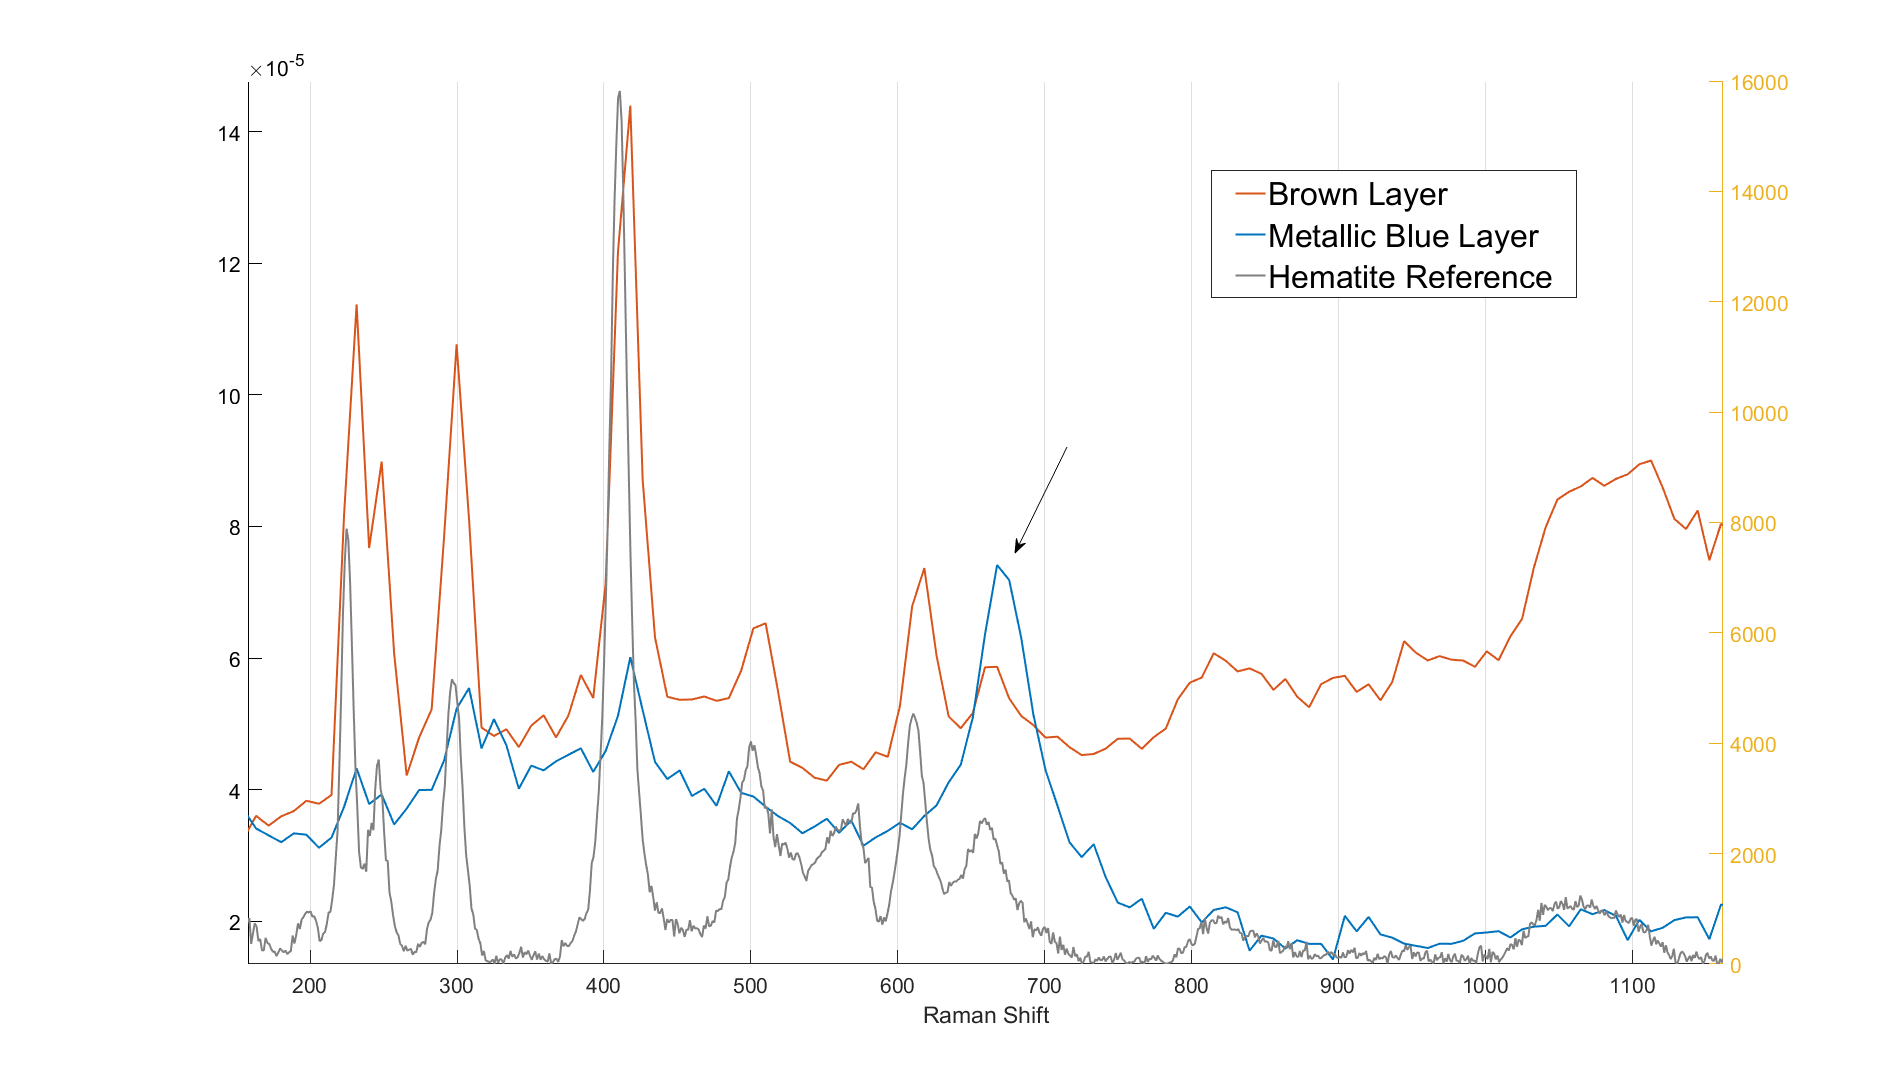
Figure 2. The measured oxide layer spectra and a reference hematite spectrum.
Hematite also has a high intensity band in the high wavenumber region. Because magnetite does not have Raman scattering in this wavenumber region, this Raman response can be used to distinguish these two oxides. The 1320 cm-1 band changes with changing magnetite/hematite ratios are presented in figure 3.
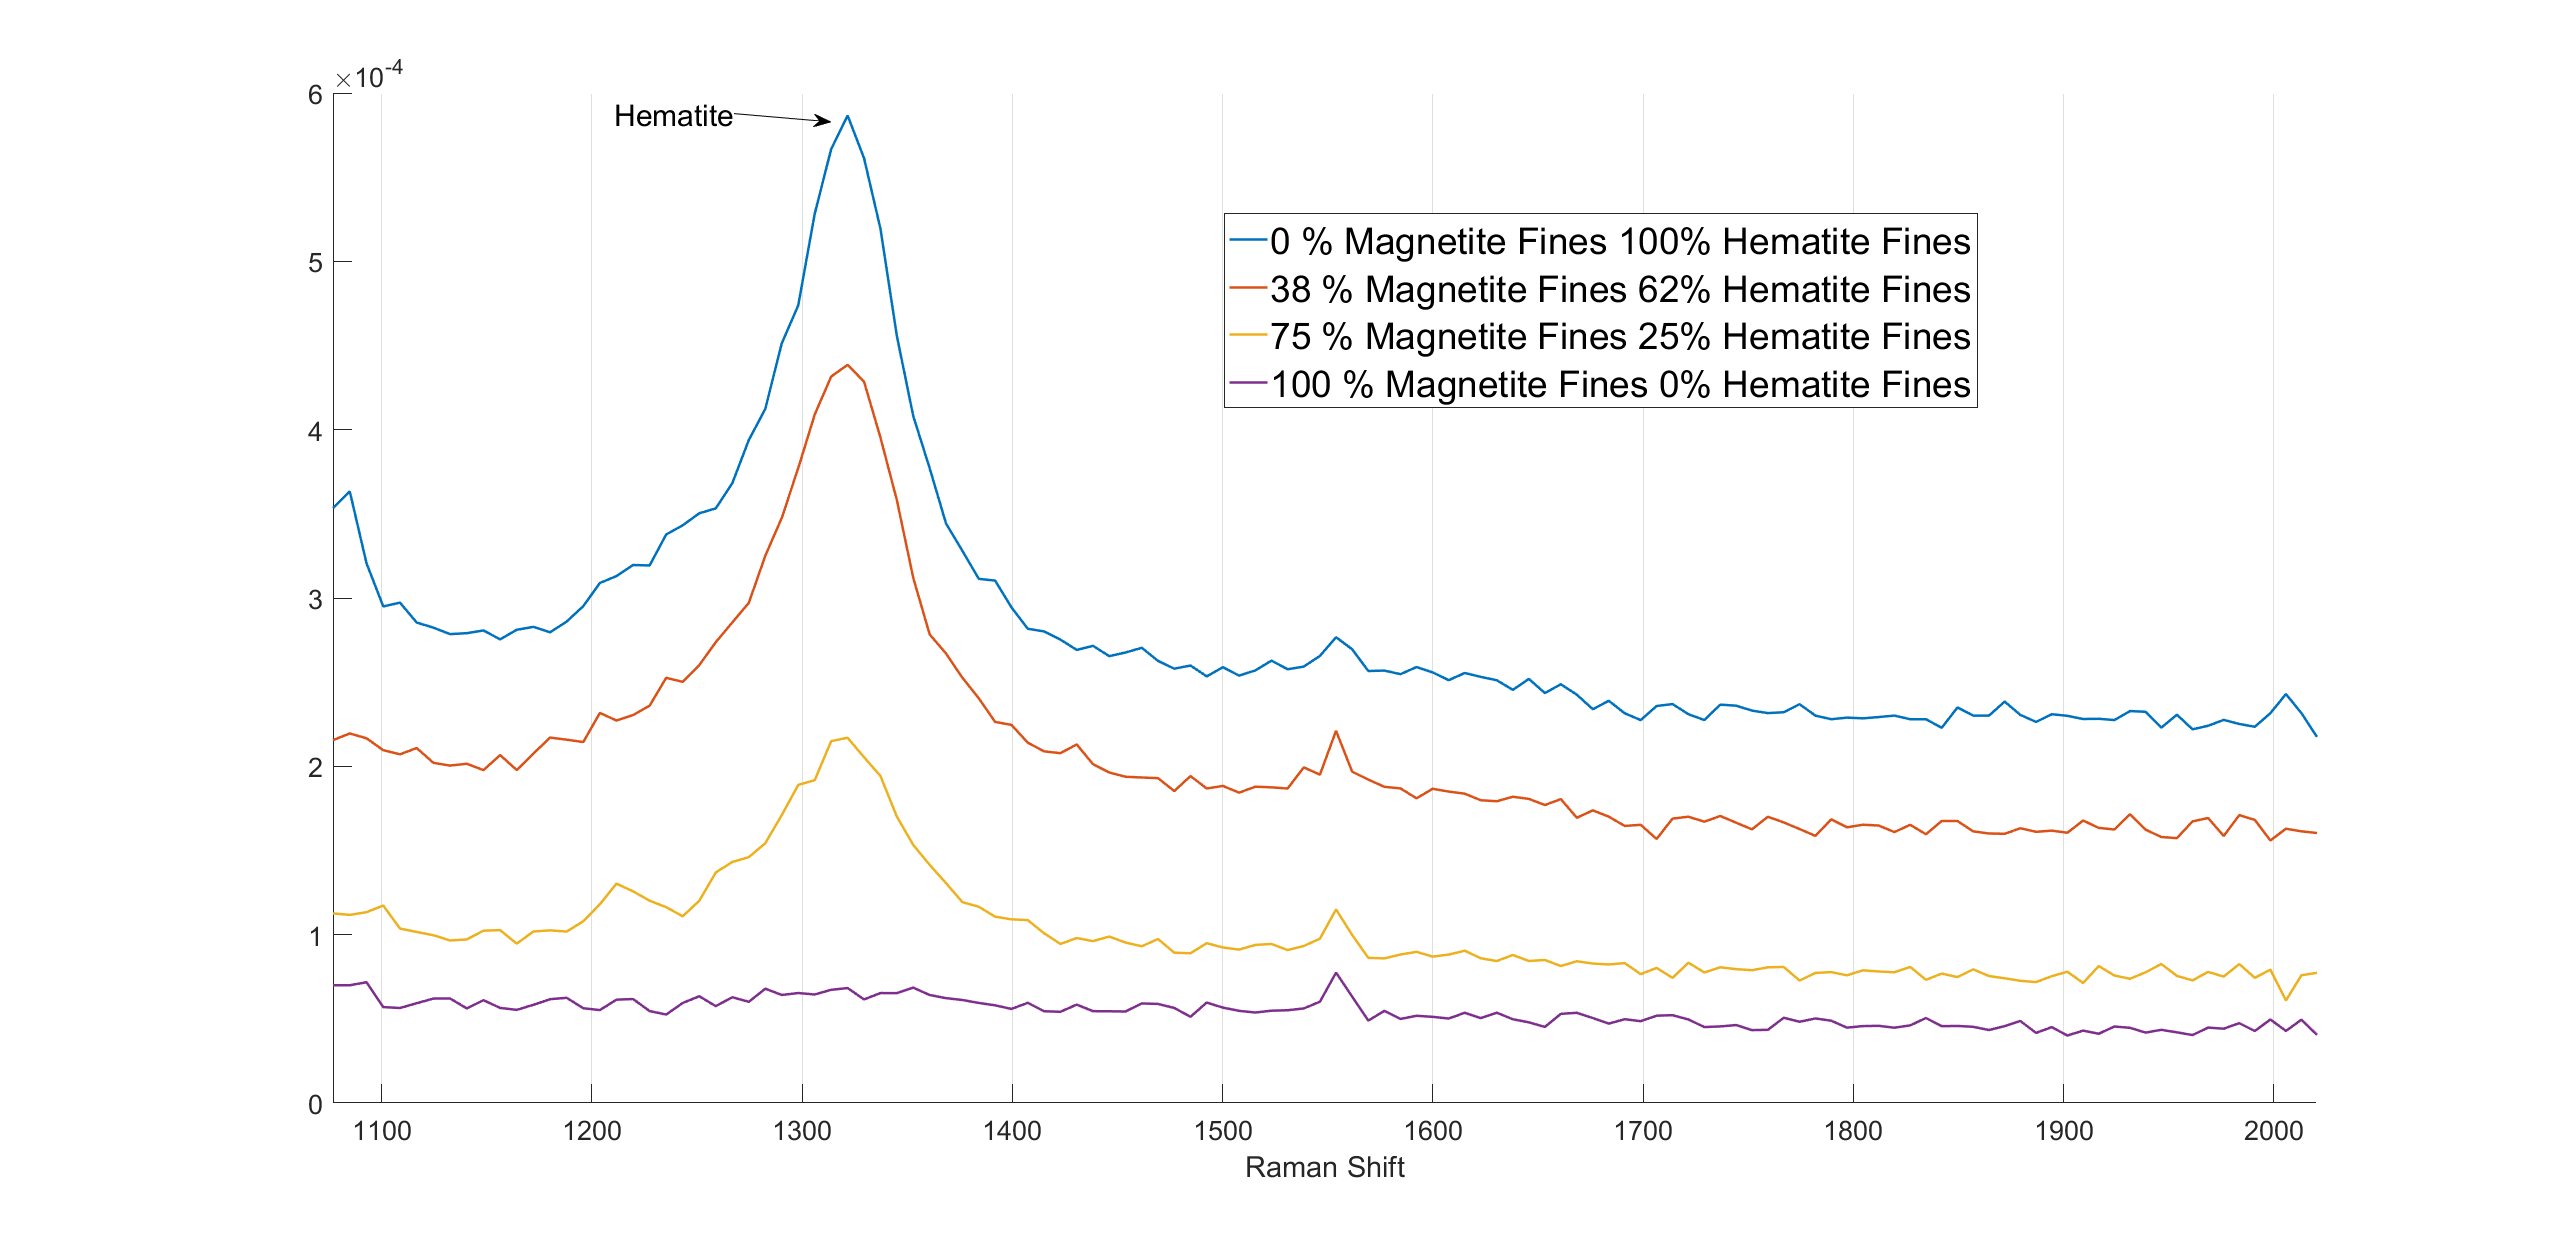
Figure 3. The spectra of varying magnetite and hematite fine mixtures.
This example demonstrates how relatively easy it is to analyse metal oxides using Raman. Almost no sample preparation is needed and when applying the proper amount of laser power, the sample is not damaged either. Raman measurement results, including iron oxide measurement results can further be analysed in order to identify and/or quantify substances.
Would you like to learn more about using Raman spectroscopy in geosciences?

References
[1] Kumar, T. S., Nurni, V., Ahmed, H., Andersson, C., & Björkman, B. (2016). Sintering Mechanism of Magnetite Pellets during Induration. Presented at the International Conference on Process Development in Iron and Steelmaking : 13/06/2016 - 15/06/2016. Retrieved from http://urn.kb.se/resolve?urn=urn:nbn:se:ltu:diva-39755
[2] Ahmadzadeh, M., Romero, C., & McCloy, J. (2018). Magnetic analysis of commercial hematite, magnetite, and their mixtures. AIP Advances, 8(5), 056807
[3] Xiong, D., Lu, L., & Holmes, R. J. (2015). Developments in the physical separation of iron ore. Iron Ore, 283–307
Author
 This blog was written by Timegate Instruments’ Senior Application Specialist Bryan Heilala. Bryan is a young and energetic chemist with a degree in M.Sc. (chemistry) and experience and background in analytical chemistry. Read more about him and the whole Timegate team.


%20kuvituskuva%20Timegaten%20korostusv%C3%A4rill%C3%A4.png?width=800&name=Spodumeeni%20(LiAlSi2O6)%20kuvituskuva%20Timegaten%20korostusv%C3%A4rill%C3%A4.png)
