Destination Flotation´19
Flotation´19 conference in the beautiful Cape Town was the first event from the series of MEI conferences for us, but definitely not the last one! We were surprised by the welcoming and warm atmosphere that invited us to join the number of socializing events; and the quality of the conference sessions were very good. The size of the conference, with record 280 participants, was small enough to get in touch with most of the participants, but big enough to attract such high-level people from science and industry to discuss about the hot topics within flotation.
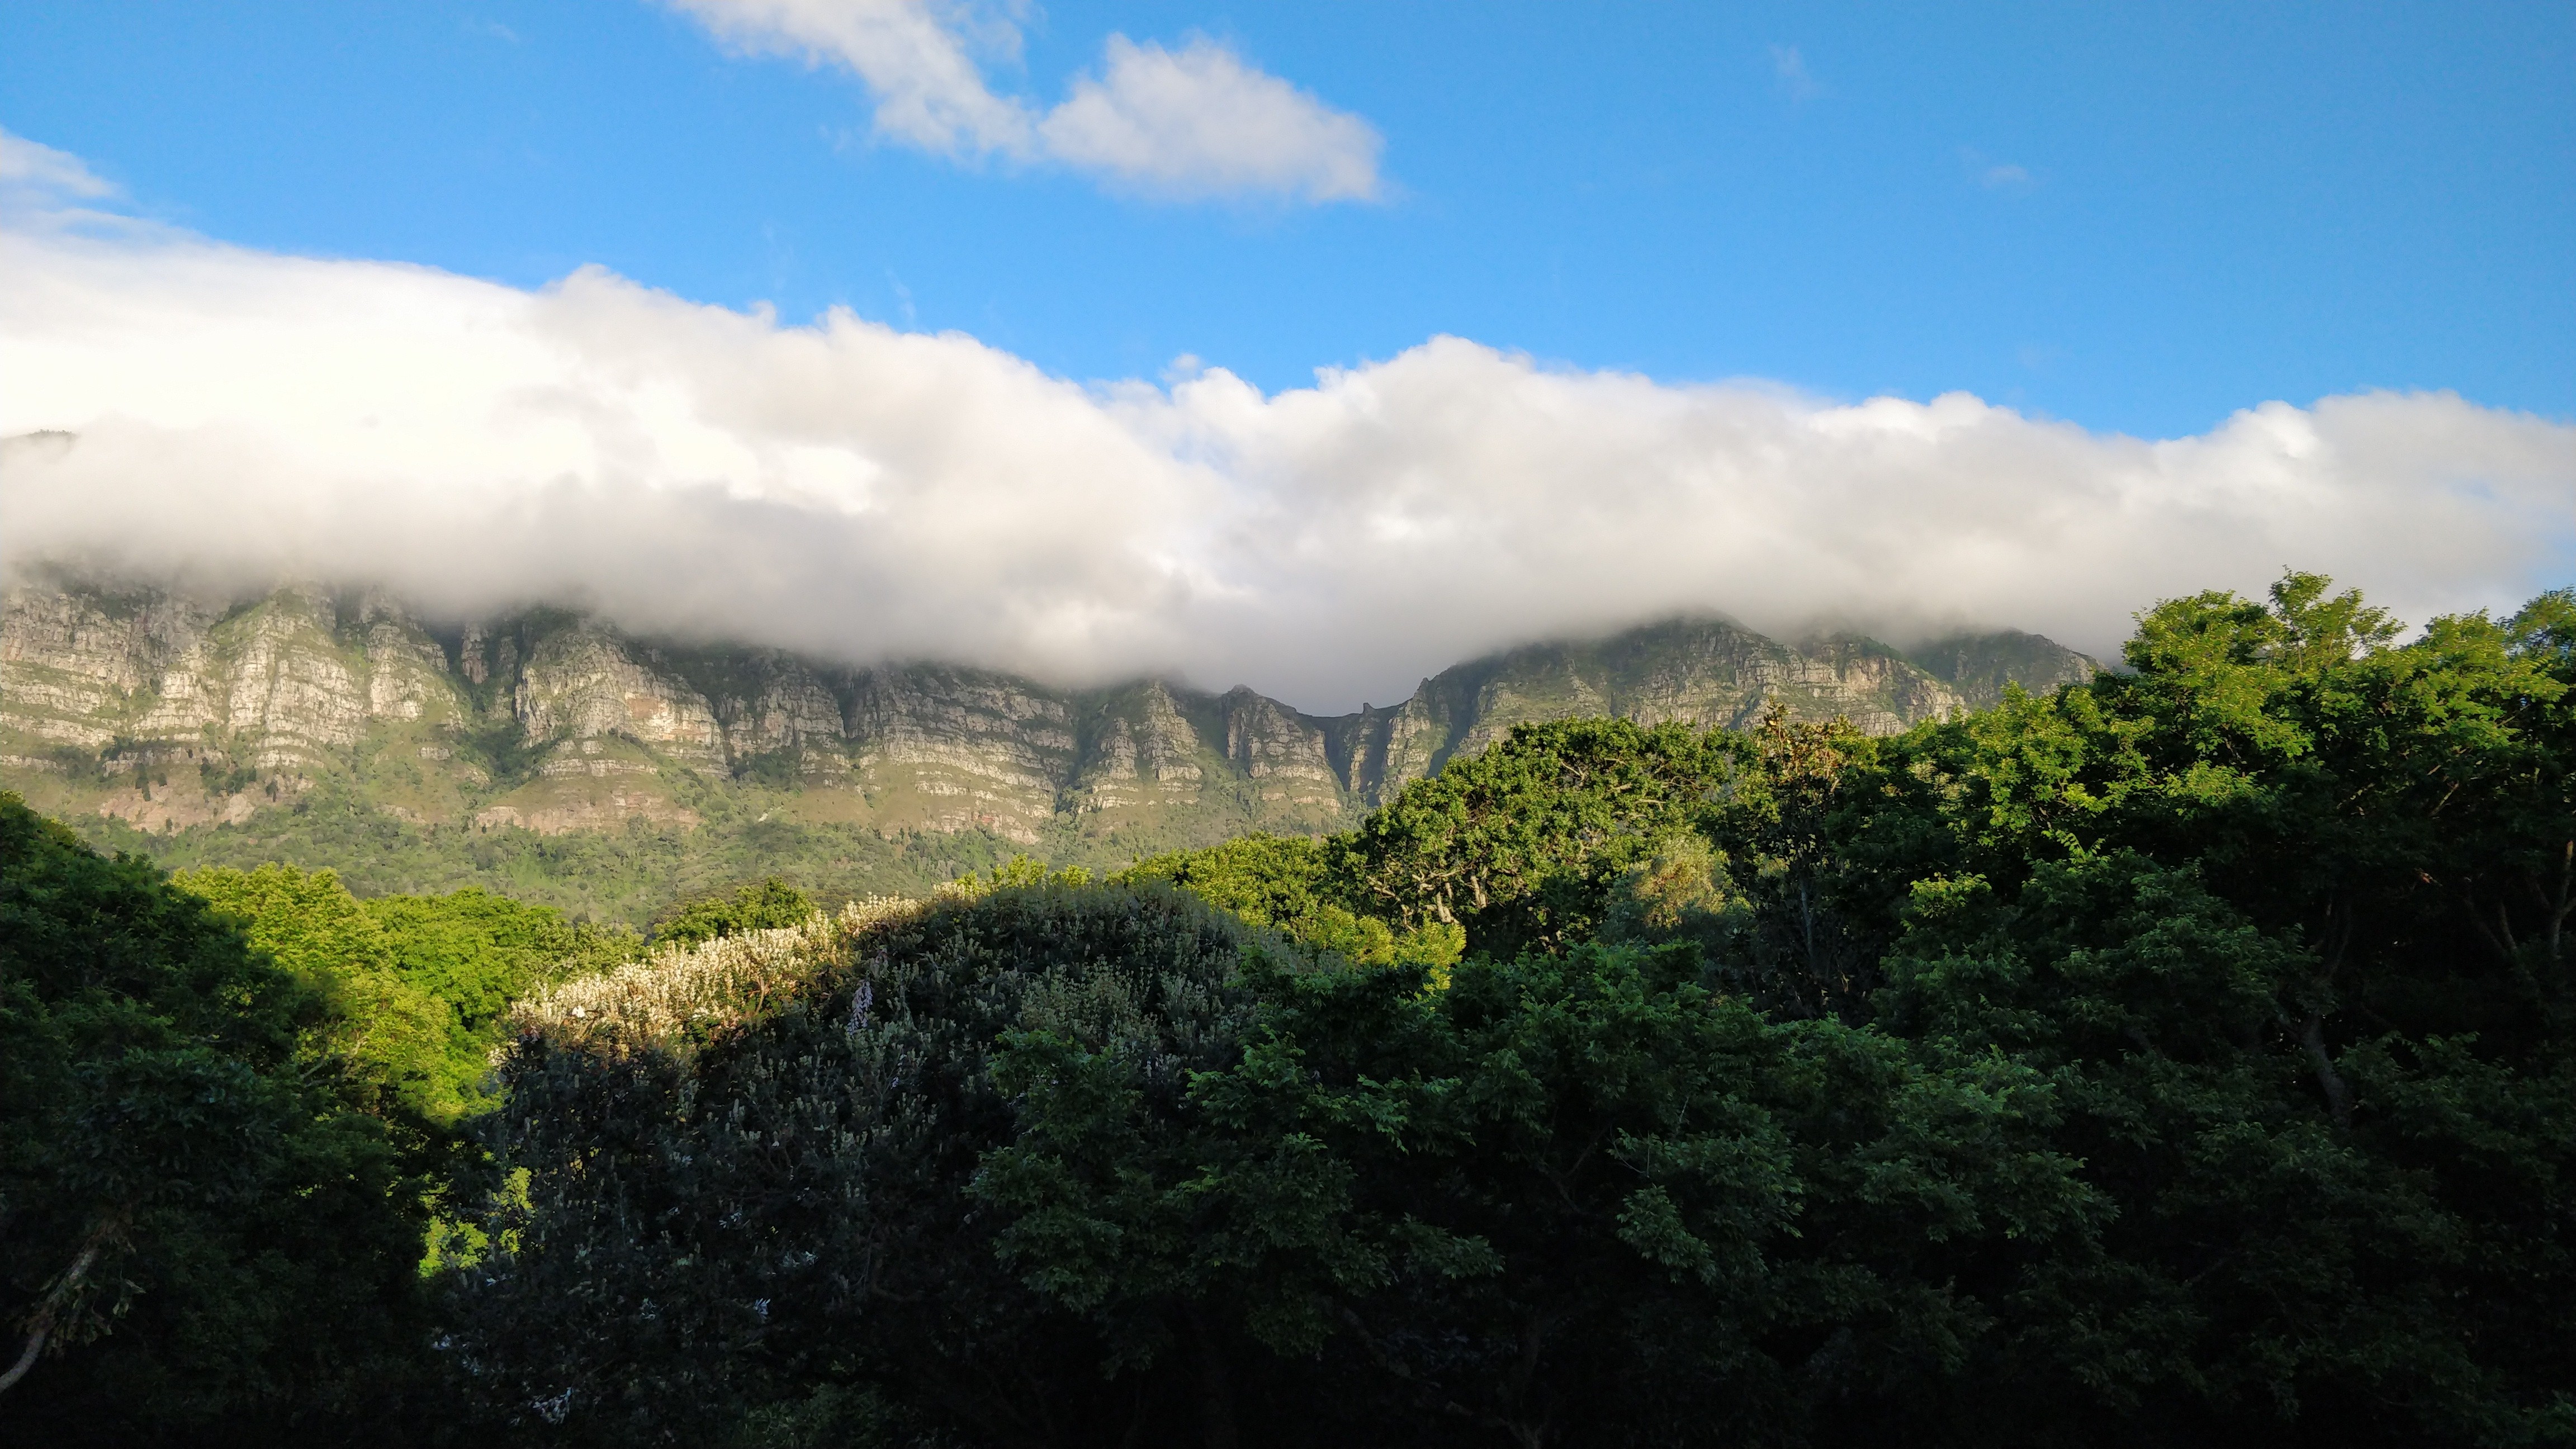
Figure 1. View towards Table Mountain from the conference venue.
The conference sessions during the first two days focused on flotation fundamentals. Topics varied from flotation process modelling and simulation to mineralogical and surface chemical characterization with some insights to the value of chemicals in mineral processing. A wide look at different variables impacting on flotation was taken, such as impacts of water quality on bubble interactions and bubble-particle attachment. Audience was very attentive and made excellent questions and comments for the presenters.
The latter half of the conference sessions discussed about applications. Approach of these presentations were way more practical and had their origin in the industry. During these days’ themes around digitalization, flotation optimisation, monitoring and novel innovation and practices were discussed. Cases were shared from all over the world, which provided a versatile look at the state of the industry.
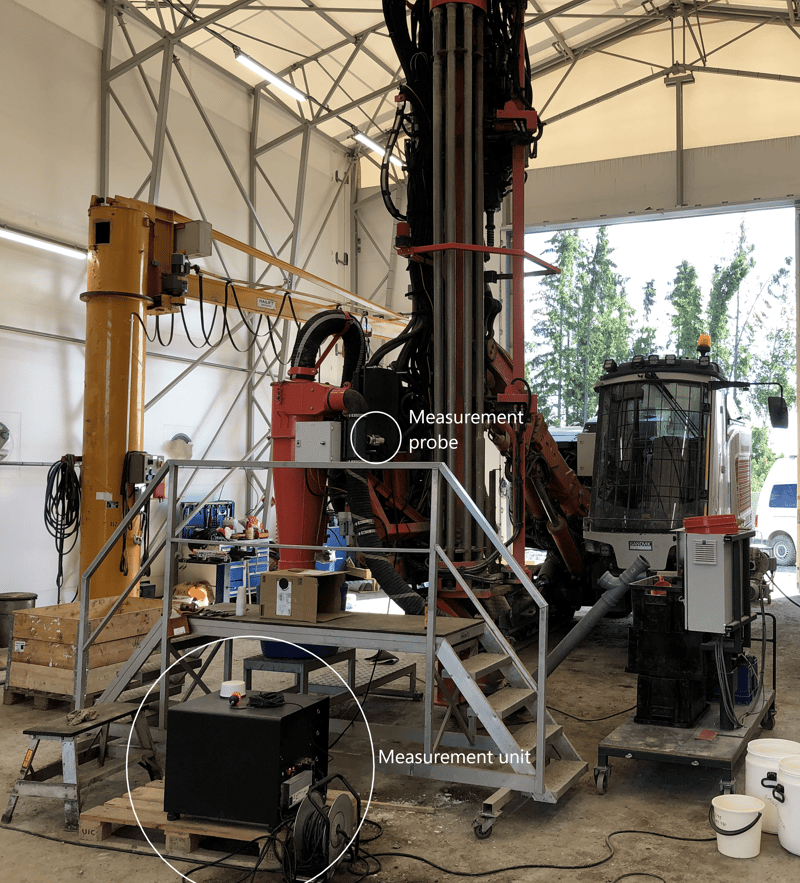
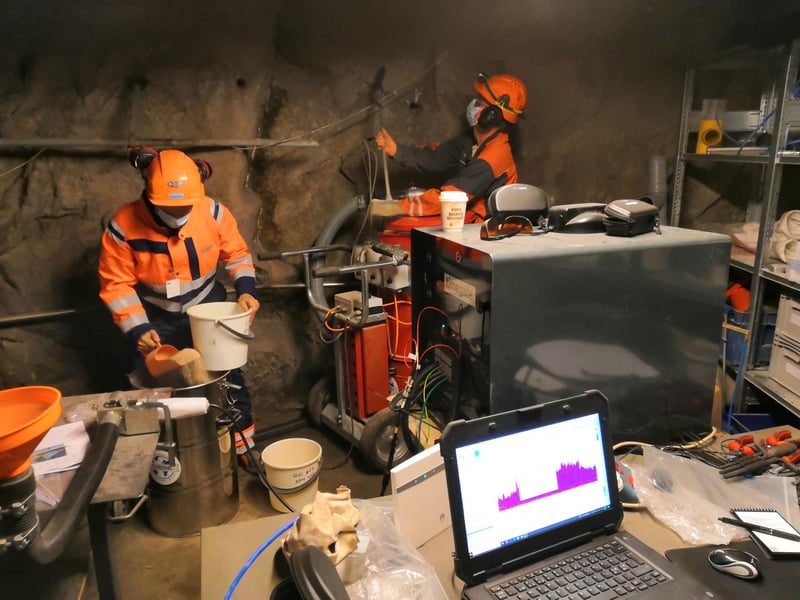
Our talk was about using time-gated Raman in flotation monitoring with the case of Keliber´s spodumene flotation tests done in the GTK Mintec Pilot Plant facilities in Finland. During the two-week test run we were able to follow the process stage real-time and online in terms of spodumene/quartz+feldspar ratio. There were two monitoring spots: concentration and waste streams. As seen in figure 1, the ratios were corresponding with each other over time in these streams.
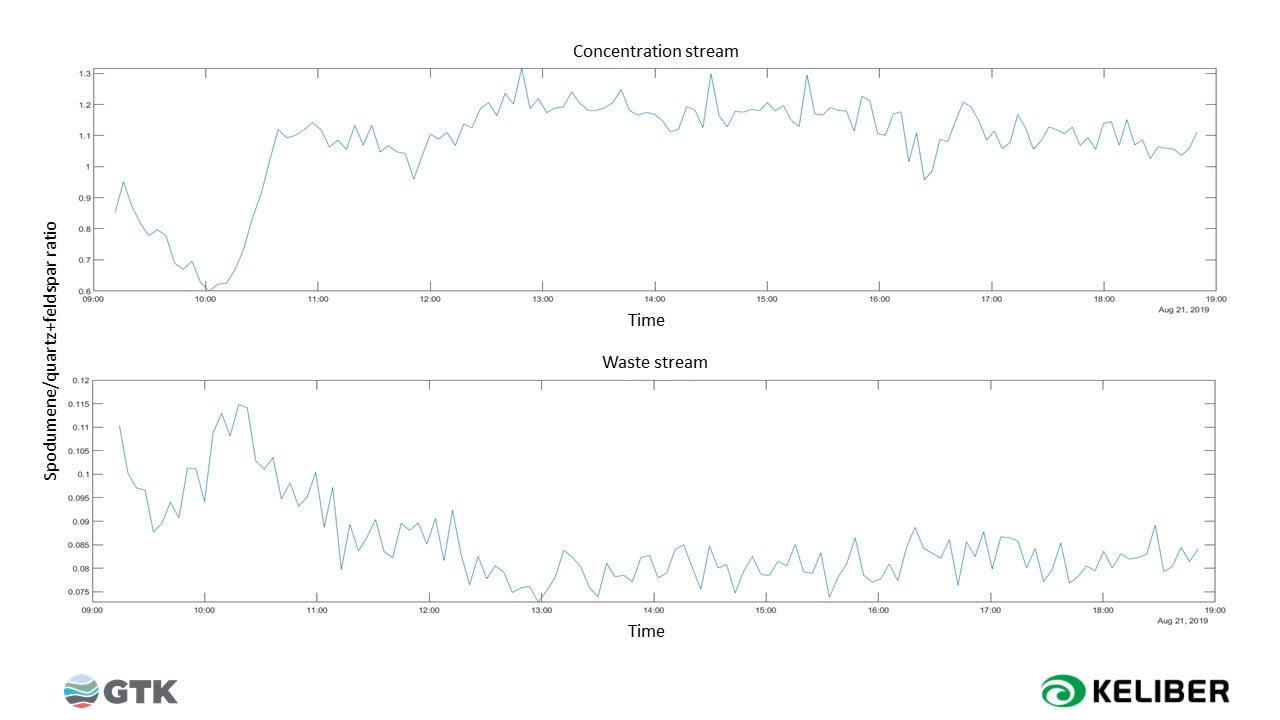
Figure 2. Spodumene/quartz+feldspar ratio in concentration (above) and waste (below) streams over 10 hours monitoring time.

Besides the excellent conference, we enjoyed the Vineyard gardens, great food and the tortoises walking around. It was great to meet so many people in the industry, introduce our technology and applications and widen our knowledge about the issues in flotation. We are looking forward to seeing you again!